Cryptocurrency trading requires astute market analysis, a significant part of which involves understanding how to read crypto charts. In this guide, we’ll provide you with five critical tips that will enhance your proficiency in learning how to read crypto charts and elevate your trading strategy.
How to read crypto charts for day trading – The Basics
Crypto charts are graphical representations of cryptocurrency price movements over a specific period. These charts provide invaluable insights to traders by revealing trends, patterns, and potential market shifts.
1. Know Your Chart Types
There are several types of crypto charts, but three are most common:
- Line Charts: These are the simplest form of charts, showing the closing price of a cryptocurrency over a set period.
- Bar Charts: More detailed than line charts, bar charts display the opening, high, low, and closing prices within a specific time frame.
- Candlestick Charts: Offering the same information as bar charts but in a more visual format, these charts are popular in crypto trading due to their detailed representation of price movements.
2. Recognise Patterns When Reading Crypto Charts
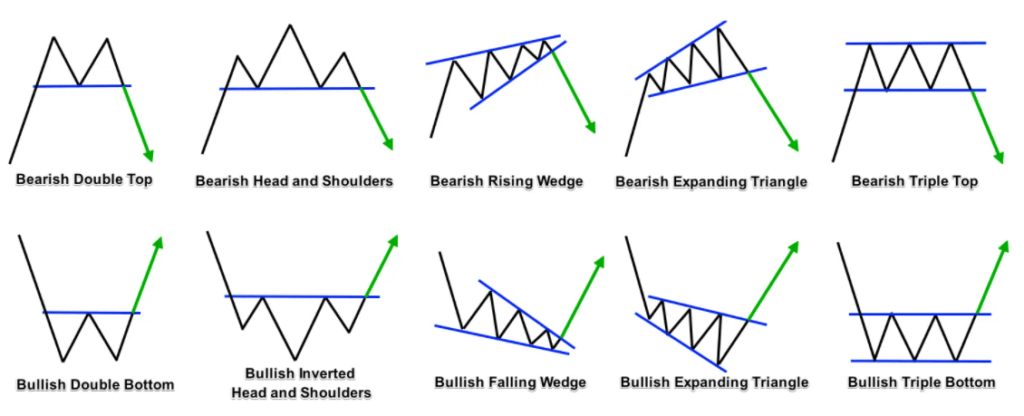
Chart patterns are formations created by price movements on the chart and can predict future price movements. They represent market sentiments and traders’ psychology. Some common patterns include:
- Support and Resistance Levels: These indicate the price levels at which buying or selling pressure becomes strong enough to change the direction of the price trend.
- Trend Lines: They represent the direction of the price movement, which can be upwards, downwards, or sideways.
- Geometric Shapes: Shapes like triangles and wedges can also provide clues about future price movements.
3. Understand Volume
Volume refers to the number of coins traded within a certain period. A high volume often corresponds to significant price moves, providing insight into the strength of a given price shift.
4. Get to Grips with Indicators
Indicators are mathematical calculations used to predict future price movements. Common indicators include Moving Averages (MA), Relative Strength Index (RSI), and Moving Average Convergence Divergence (MACD).
5. The Importance of Timeframes
The timeframe for analysis significantly impacts the information you receive. Shorter timeframes might be suitable for day traders, while longer ones are generally better for long-term investors.
On-chain Data Analysis with Spot On Chain
In addition to chart analysis, on-chain data analysis is becoming increasingly essential in the crypto trading landscape. It involves examining transaction data on blockchain networks to identify trends, patterns, and potential trading opportunities.
Enter Spot On Chain, a revolutionary platform that simplifies and streamlines on-chain analytics. Spot On Chain offers real-time updates, tracking transactions across various blockchains. It presents this data in a user-friendly, easily understandable format that’s invaluable for both seasoned traders and newcomers alike. It’s a game-changer, set to redefine how traders interact with blockchain data.
Wrap Up
Mastering how to read crypto charts is crucial for effective trading. Combined with on-chain data analysis tools like Spot On Chain, these skills can dramatically enhance your trading strategy and outcomes. As the saying goes, “Knowledge is power.” Happy trading!
For more detailed information about reading crypto charts, check out these external resources: Investopedia’s guide to reading crypto charts and CoinMarketCap’s comprehensive crypto chart reading tutorial.
Explore the Crypto Trading section for more related article